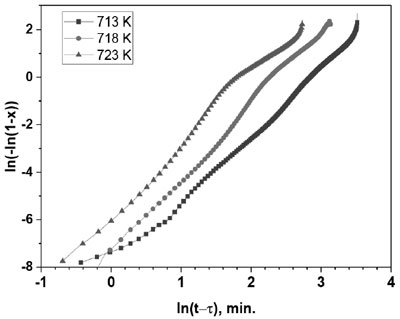
Fig. 4. JMA plots of ln[-ln(1-x(t))] versus ln(t-τ)
at different annealing temperatures
JOURNAL OF SCIENCE AND TECHNOLOGY OF METALS
VIETNAM FOUNDRY AND METALLURGY SCIENCE AND TECHNOLOGY ASSOCIATION
Fig. 4. JMA plots of ln[-ln(1-x(t))] versus ln(t-τ)
at different annealing temperatures
Truy cập trực tiếp website www.doi.org và nhập chỉ số DOI của bài báo vào ô tìm kiếm.

Nếu chỉ số đã được công nhận kết quả tìm kiếm sẽ được chuyển về website xuất bản trực tiếp của bài báo.